Partners
Project periode
KVL, The Royal Veterinary and Agricultural University, Denmark
2002 - 2004
destructive testing.This renders the produce useless for selling and limits
the testing to selected samples.
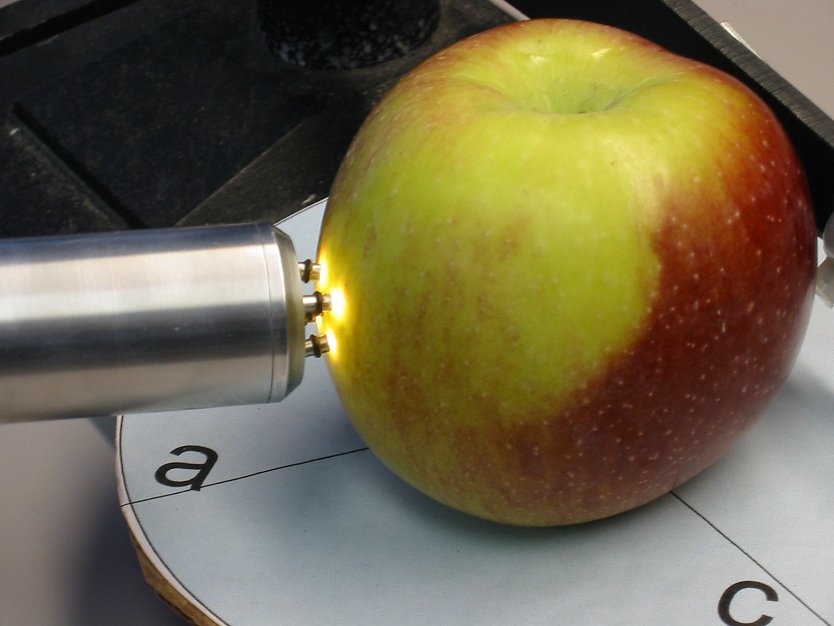
Near infrared (NIR) spectroscopy is a technology based on radiation in the near infrared area
(approximately 650 - 1100 nm).
By shining light containing NIR wavelengths into a fruit and analysing the reflected signal,
one can deduce information about the internal qualities of the specimen.
Previous research has established correlation between NIR reflectance and sugar content.
Work quoted in the publication section describes how mealiness and watercore in apples can be detected,
along with taste characteristics of carrots. Further research was conducted in order to evaluate the possibilities for assessing taste quality of apples.
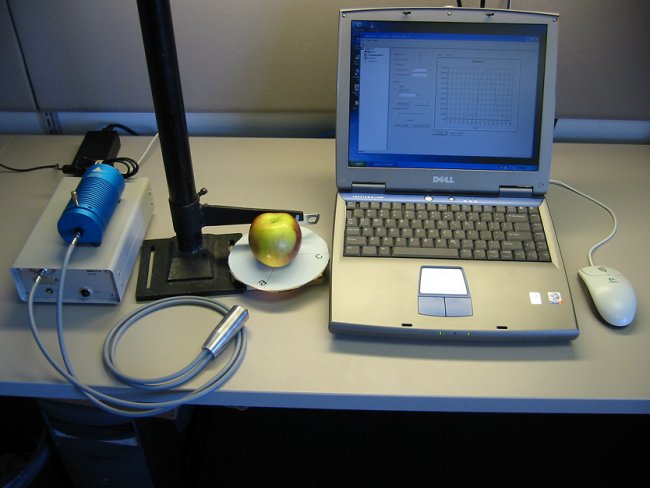
Experimental set-up. The spectrometer is the grey box to the left.
The blue cylinder contains the light source. Fibre optic cables combine these to the probe.
Apples are positioned on a turntable for accurate positioning of the probe during measurements.
Data are recorded on the computer.
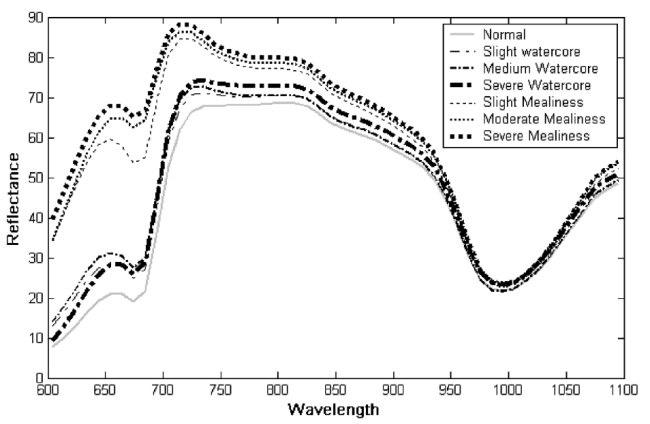
NIR spectra from mealy apples, and apples with watercore
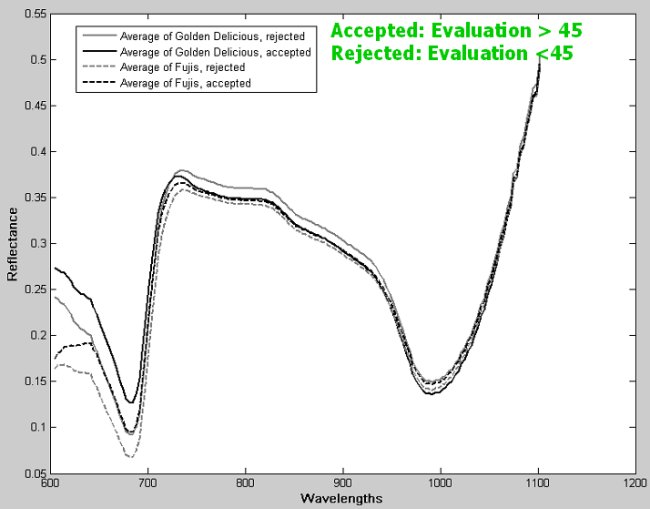
NIR spectra from Golden Delicious and Fuji apples of varying quality.
The grey lines represents an average of spectra from apples (Fuji and Golden Delicious respectively)
which a taste panel found had an acceptable taste. The black lines is the average of apples
which the taste panel rejected, based on their taste
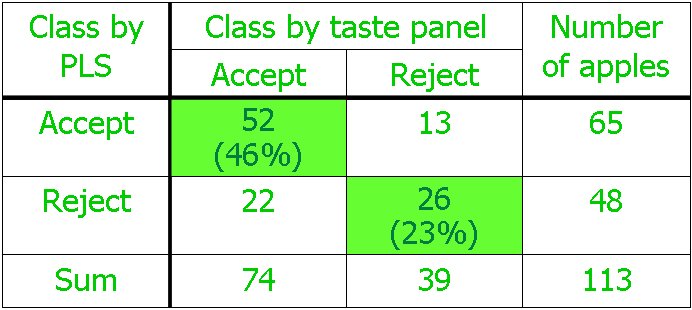
was used to duplicate the evaluation of a taste panel.
A sorting system was created, based on NIR spectra and PLS.
The system was trained on a batch of apples, which had been evaluated by a taste panel.
After training, a batch of 113 apples was sorted. For 52 apples, the system
agreed with the taste panel in declaring the apples acceptable.
Further, 26 apples were rejected by both the taste panel and the system.
Of the rest, 22 apples were rejected by the system, but accepted by the taste panel,
13 apples, which were rejected by the taste panel, were accepted by the system.
Adding the numbers, the system managed to duplicate the taste panel in 69% of the cases, and failed in 31%.
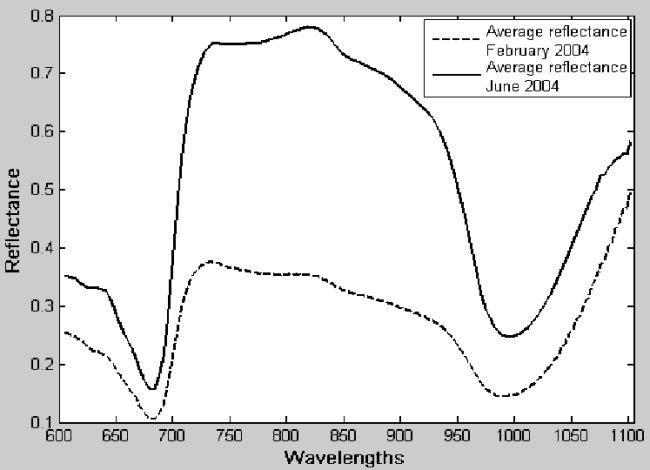
NIR spectra from Golden Delicious apple showing the influence og storage:
The solid line represents average of spectra acquired in June, when the apples were
perfectly acceptable. The dashed line is the average of spectra from the February,
the following year. By then, the taste of the apples had deteriorated significantly.